Project Kojak: The Practice of Yoga in the City
June 25, 2015
Contents:
Introduction and data set
Boolean keyword matching
Latent semantic indexing (LSI)
The basic assumption of LSI
Singular vectors
Querying the corpus
On the choice of the number of singular vectors
Visualizing documents and queries in LSI space
Using LSI to compare the NYC and LA corpora
Interactive maps
Conclusions
Technical note
Introduction and data set
Yoga is a centuries-old practice 
Sanskrit character for the “Aum” sound. In his “Autobiography of a Yogi”, Paramahansa Yogananda writes “The potencies of sound and of the human voice have nowhere else been so profoundly investigated as in India. The Aum vibration that reverberates throughout the universe has three manifestations, those of creation, preservation, and destruction. Each time a man utters a word he puts into operation one of the three qualities of Aum.” that was started in India by ascetics who needed to maintain good physical health during their long meditation sessions. While it declined in its country of origin, over the past fifty years yoga took off in the West. In fact, one of the founders of the modern yoga movement, B.K.S. Iyengar, is reported to have said that yoga was saved by the West. How did Westerners do this? Simply: they turned this revered practice into a business! And now that it is a business, we can ask some pointed questions about it, and as data scientists maybe we can come up with some quantitative answers.
What motivates people to practice yoga? What do they value in their practice? Which types of yoga are most popular? How does practice depend on where it is done? How can we help people find their way in this world of yoga? To answer these questions I looked at Yelp reviews of yoga businesses in the New York City and Los Angeles areas. For the purpose of this project, a yoga business is any business with a connection to yoga, so this includes studios exclusively devoted to yoga teaching and practice, yoga apparel stores, gyms that offer yoga classes, etc. The table below shows how many businesses and reviews I found for the New York City and Los Angeles metropolitan areas:
Table 1: Summary of the data sets used for this analysis.
| New York City | Los Angeles | |
|---|---|---|
| Number of listed yoga businesses: | 796 | 749 |
| Number of reviewed yoga businesses: | 560 | 749 |
| Number of reviews: | 9,324 | 27,953 |
The number of businesses is about the same in both areas, but the number of reviews is three times larger in Los Angeles, implying a difference in the number of reviews per business. This is shown in the following superimposed histograms (each normalized to an area of 1 to facilitate comparison; also note the log scale along the y axis):
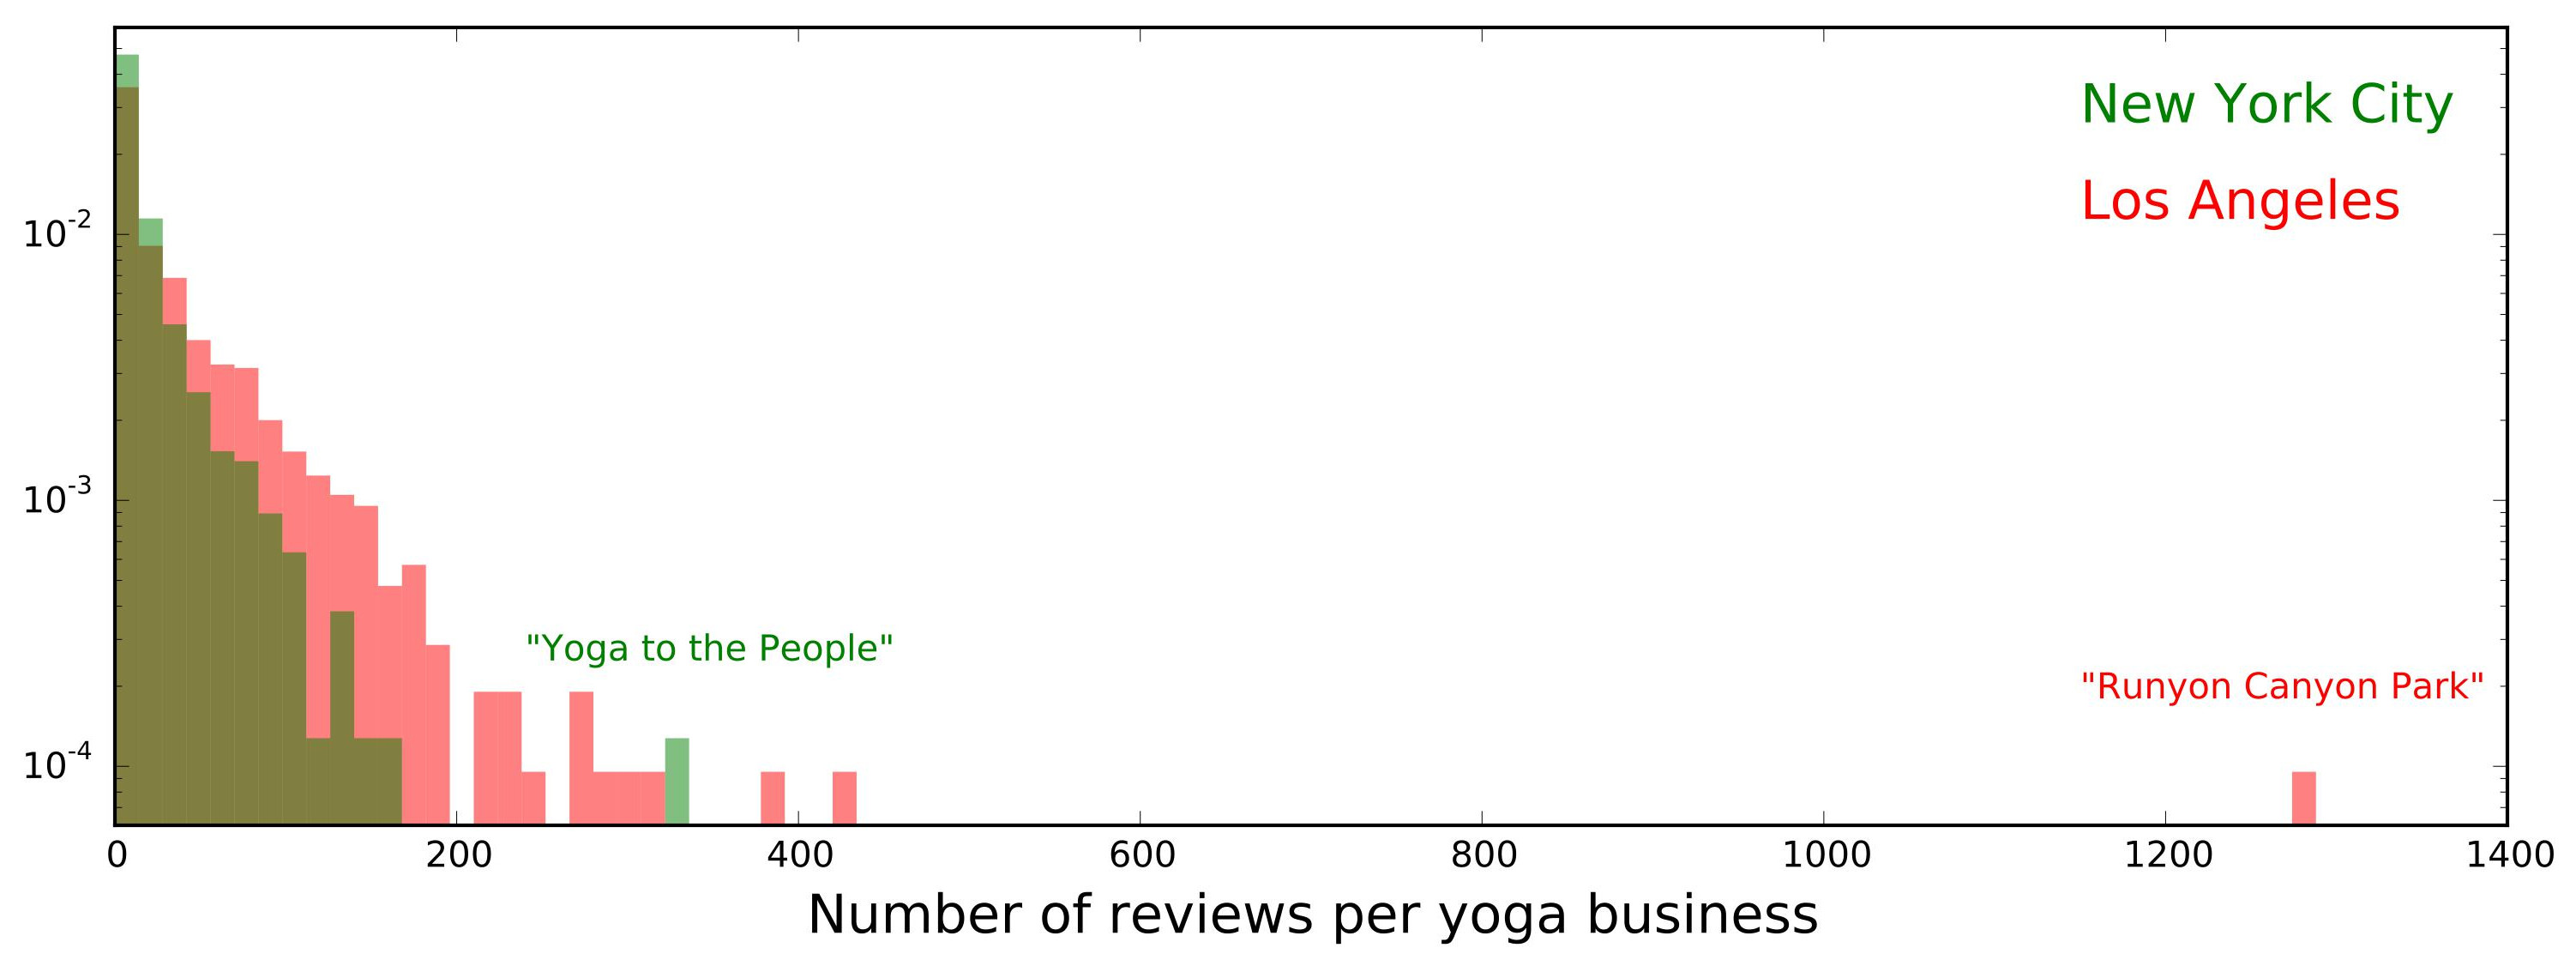
The distribution of the number of reviews per business has a longer tail for LA than for NYC. A couple of outliers are worth noting: “Runyon Canyon Park” (1285 reviews) is a 160-acre park in LA, with lots of hiking trails and offering free yoga classes several times a week. Not all the reviews about the park are about the yoga. In NYC, “Yoga to the People” (331 reviews) offers yoga classes (some of which are donation based) at several studios in Brooklyn and Manhattan. They have a lot of customers.
Boolean keyword matching
For an initial exploration of the reviews, I concatenated them by business and did Boolean queries on keywords used to label yoga styles. The list of keywords is a small extension of the yoga styles described in William Broad’s book on the science of yogaWilliam J. Broad, “The Science of Yoga: the Risks and the Rewards”, Simon & Schuster, 298pp (2012). See pg. xxiii. . Most yoga styles have somewhat exotic names (e.g. Vinyasa, Ashtanga, Anusara,…), so that the keywords are unique and unambiguous. The unambiguousness should help the precision (the probability that a review containing a given keyword refers to a business offering classes in the corresponding style of yoga), whereas the uniqueness should help the recall (the probability that a business offering a particular style of yoga will be found by looking for the corresponding keyword in the reviews)Identifying a studio's yoga style via Yelp reviews may seem a somewhat roundabout approach. Why not check the studio's website directly? The answer is that this is impractical when dealing with a large number of studios, since no two websites organize information in the same way. The direct approach will have to wait for the semantic web (see Tim Berners-Lee, James Hendler, Ora Lassila, “The Semantic Web”, Scientific American, May 2001). . For each yoga style keyword, I estimated the probability for it to appear at least once in the concatenated reviews of a business, or in that business’s name. This was done separately for NYC and LA. Note that it is possible for more than one keyword to appear in reviews of a given business, since some studios offer classes in more than one style. The result is shown in the figure below:

It appears that Bikram and Vinyasa yoga are the most popular styles in both NYC and LA, with Vinyasa being significantly more popular in NYC than in LA. Other significant findings are the popularity of Jivamukti in NYC and Kundalini in LA. Jivamukti was founded in NYC in 1984, whereas Kundalini has New Age connotations that may explain its popularity on the West Coast.
Suppose now that we wanted to identify yoga studios that offer strenuous yoga classes. We could again proceed with a Boolean keyword search, querying the reviews for the word “strenuous”. However, this would not be as effective as the above search for yoga styles, which have unique names. A query based on the word “strenuous” will have low recall because there are so many alternative ways of describing a strenuous yoga class. At the very least we should include synonyms in our query (“grueling”, “arduous”, “exhausting”), and combinations of words (“hard workout”). This is no longer so straightforward anymore, which is why we need a more sophisticated tool…
Latent semantic indexing (LSI)
Latent Semantic IndexingScott Deerwester et al., “Indexing by Latent Semantic Analysis”, JASIS 41, 391-407 (1990). (or LSI for short) is an algebraic approach to text processing that is based on Singular Value DecompositionDan Kalman, “A Singularly Valuable Decomposition: The SVD of a Matrix” (2002). , Gilbert Strang, “The Fundamental Theorem of Linear Algebra”, American Mathematical Monthly 100, 848-855 (1993). (SVD). For readers unfamilar with LSI, the following subsection introduces with a minimum of technical details the concepts and assumptions that motivate LSI and relate it to SVD.
The basic assumption of LSI
Given a dictionary (an ordered list of words), documents in a corpus can be mapped to numerical vectors by counting how many times the ith word of the dictionary occurs in a document, and assigning that count to the ith component of the corresponding vector. Instead of word counts, normalized measures of word frequency such as TF-IDF weights“Term Frequency - Inverse Document Frequency”, see for example www.tfidf.com. are often preferred and can also be used. This document-to-vector mapping is all we need to formulate the basic assumption of LSI:
the smaller the angle between two document vectors, the higher the semantic closeness between the corresponding documents.
This is quite a remarkable assumption, since no reference is made to grammar, or language, or even word order! Only word frequencies matter. Operationally, the semantic similarity between two documents is computed as the cosine of the angle between their vectors. This is called cosine similarity. For unit vectors it is a simple dot product.
Singular vectors
If a document can be represented by a vector of term frequencies, then a corpus of documents can be represented by a matrix: the term-document matrix, which has the documents as column vectors. This matrix allows us to perform a couple of useful tasks: index the information contained in the corpus, and search it for documents that are similar to a given query. The indexing part is done by applying SVD to the term-document matrix in order to obtain the so-called singular vectors. These vectors exist in the same space as the document vectors (called term space in the following). Each singular vector is a unit vector along which the sum of the squares of the document vector projections is maximized. The maximization is unconstrained for the first singular vector. However, each subsequent singular vector is constrained to be orthogonal to all the previous ones. Now, note that by maximizing sums of squared projections one decreases the angles between each singular vector and the document vectors. Therefore, from a semantic point of view, and invoking the LSI assumption, a singular vector captures meaning components common to all document vectors, and different singular vectors capture different meaning components since they are orthogonal. In principle the number of singular vectors can be very large: it is equal to the rank of the term-document matrix, which can be as large as the smaller of the number of terms and the number of documents. However, as we will see below, it is not necessary to use all singular vectors produced by the SVD procedure. Typically between 50 and 150 singular vectors are enough to index the entire corpus.
Querying the corpus
Suppose now that we have a query, in the form of a short paragraph, a sentence or a set of keywords, and that we wish to retrieve corpus documents that are semantically close to our query. One way would be to compute the cosine similarity between our query and each corpus document in the original term space, and retrieve those documents for which the cosine similarity exceeds some threshold. However, proceeding this way ignores the semantic inter-document connections revealed by the singular vectors. The LSI approach first transforms both the query vector and the document vectors from term space into LSI space (the space spanned by the selected singular vectors), and then computes cosine similarities in LSI space. This approach finds documents that are close in meaning to the query but would otherwise remain undiscovered because they use different words, or have misspellings, etc.
On the choice of the number of singular vectors
SVD has many applications outside of text processing. A common issue in those applications is the choice of the number of singular vectors to retain as “relevant” or “significant” for the problem at hand. One approach uses the singular values - for our text processing problem, singular values are defined as the sum of the squares of the projections of the document vectors on the singular vectors. Thus there is one singular value per singular vector, and by construction the singular value becomes smaller as the order of the associated singular vector increases. To take an example, here are the first ten singular values, with their associated singular vectors, for our LA corpus of yoga business reviews:

The singular vectors in the right-most column are expressed as linear combinations of terms in the LA corpus dictionary. Each term is essentially a basis vector in LA term space, that is, a vector whose components are all zero except for the one which corresponds to the alphabetical location of the term in the dictionary. The coefficients in front of the terms are the coefficients of the expansion of the singular vectors in the term-space basis. Only the first six terms of each expansion, those with the largest coefficients, are shown. Note that the terms involved in a given singular vector are not necessarily strongly related, see for example “cycling” and “acupuncture” in the tenth singular vector. Furthermore, terms may contribute to a singular vector with a negative or a positive coefficient, so that coefficients cannot be interpreted as probabilitiesNote also that the coefficients in the singular vector expansion add up to 1 in quadrature. If they were probabilities they would add up to 1 linearly, as they do in topics obtained via Latent Dirichlet Allocation for example. . Hence singular vectors do not represent “topics” in the usual sense of the word, but they are sometimes referred to as “latent topics” (or as “latent dimensions”, or “factors”).

Figure 3: Singular values associated with singular vectors in the LA corpus, sorted in decreasing order. Inset: zoom in on the first 30 singular values. The singular values in the above table exhibit a sharp decrease at the beginning, followed by a flattening out. This is illustrated in Figure 3. In many statistical applications of SVD, the initial decrease of the singular values is much sharper than here, and the number of singular vectors that are to be kept is chosen by finding the elbow in this curve, where it starts to flatten out. Looking at the inset in Figure 3, this would correspond to about five singular vectors, but the main plot suggests perhaps a higher number. In any case, singular values in the flat section of the curve are not negligible compared to the first few, so ignoring them on the basis of size does not seem justified.
A better approach, suggested by Deerwester et al.2, is to select a few potentially representative “test” queries and compare the documents returned by LSI with those obtained from a manual scan of the corpus. This allows one to measure the accuracy of LSI queries. By plotting the average accuracy over test queries as a function of the number of singular vectors retained and of the cosine similarity threshold, an optimal setup can be found. Deerwester et al. recommend that between 50 and 150 singular vectors be retained. We will use 100.
Visualizing documents and queries in LSI space
With our choice of the number of singular vectors, LSI space has 100 dimensions. It is instructive to look at 2D-projections of corpus documents on the first few singular vectors (latent topics). For four singular vectors there are six 2D-projections to plot:

Each dot in each of these plots represents a corpus document; its coordinates are given by the projections of the document vector on two singular vectors. Note that projections on the first singular vector are always positive, since document vectors have positive components (being term frequencies). The shapes of these scatter plots are interesting: in some projections groups of documents appear to align themselves along specific directions. To gain insight into this phenomenon we introduce a few queries:
"massage, facial, spa"
"gym and fitness club"
"pilates"
"bikram and hot yoga"
These queries are indicated by colored arrows in the next set of plots. Each arrow is normalized to unit length in the full 100-D LSI space, since only its direction matters for document retrieval purposes. The documents retrieved by the queries are shown with colored dots (except for the yellow dots, which are for documents that were not retrieved by any of the queries, and for the black dots, which represent documents retrieved by more than one query).

There is clearly a correlation between the colors of the dots and their arrangement along latent topics. This is because the queries themselves were chosen by examining the singular vectors in Table 2. For example, the query “massage, facial, spa” is inspired by the second singular vector, and plots involving Latent Topic 2 show indeed that this vector can identify and isolate documents related to this query (red dots). The second query, “gym and fitness club”, is associated with the third singular vector and aligns with Latent Topic 3 (green dots). As for the last two queries, they are identified by Latent Topic 4, “pilates” with positive values (blue dots), and “bikram and hot yoga” with negative values (turquoise dots).
Note that the query arrows do not align perfectly with the bulk of the documents they help retrieve. This is because documents contain more topics and meanings than are captured by the queries. These additional topics and meanings are like weights that pull the documents in various other directions.
Using LSI to compare the NYC and LA corpora
We now proceed with some LSI queries on the NYC and LA yoga corpora. For comparison purposes we start with the same yoga-style queries that we used for Boolean keyword matching. The result is shown below:

There are some remarkable differences between this plot and the one based on Boolean queries (Figure 2). To better visualize these, Figure 7 shows the distribution of the difference between the LSI and Boolean retrieval probabilities of the yoga-style queries, in the LA corpus versus the NYC corpus. 
Figure 7: Retrieval probability difference between LSI and Keyword Matching, for the yoga-style queries, in the LA corpus versus the NYC corpus. The LSI cosine similarity threshold is set at 0.10, and the keyword matching threshold is set at 1. Points near the origin of the plot indicate little change in retrieval probability. A majority of points lies in the first quadrant (positive coordinates along both axes), implying that LSI tends to have higher retrieval probability than simple keyword matching. This is expected since LSI can identify synonymous expressions. However LSI is above all a semantic tool, capable of distinguishing relevant from irrelevant query mentions (more on this later). Hence it is also possible for some queries to have lower LSI retrieval probability (points in the third quadrant). In any case the second and fourth quadrants are empty, showing that the LSI effect has the same direction in the NYC and LA corpora. Finally, the LSI effect appears to be larger in the LA corpus than in the NYC one (points above the diagonal in the first quadrant and below it in the third quadrant). This could be a corpus size effect. Since the LA corpus is larger, it is likely to contain more instances of synonymy, thereby extending the LSI retrieval power of a query.
For clarity we only labeled the two most extreme points in Figure 7; they correspond to the “Bikram” and “Yoga nidra” queries. A manual scan of relevant reviews yields the following insights about these:
“Bikram”
Bikram yoga offers a beginning class of 26 poses, always the same, that are taught in a room heated to 104°F by Bikram-certified teachers. 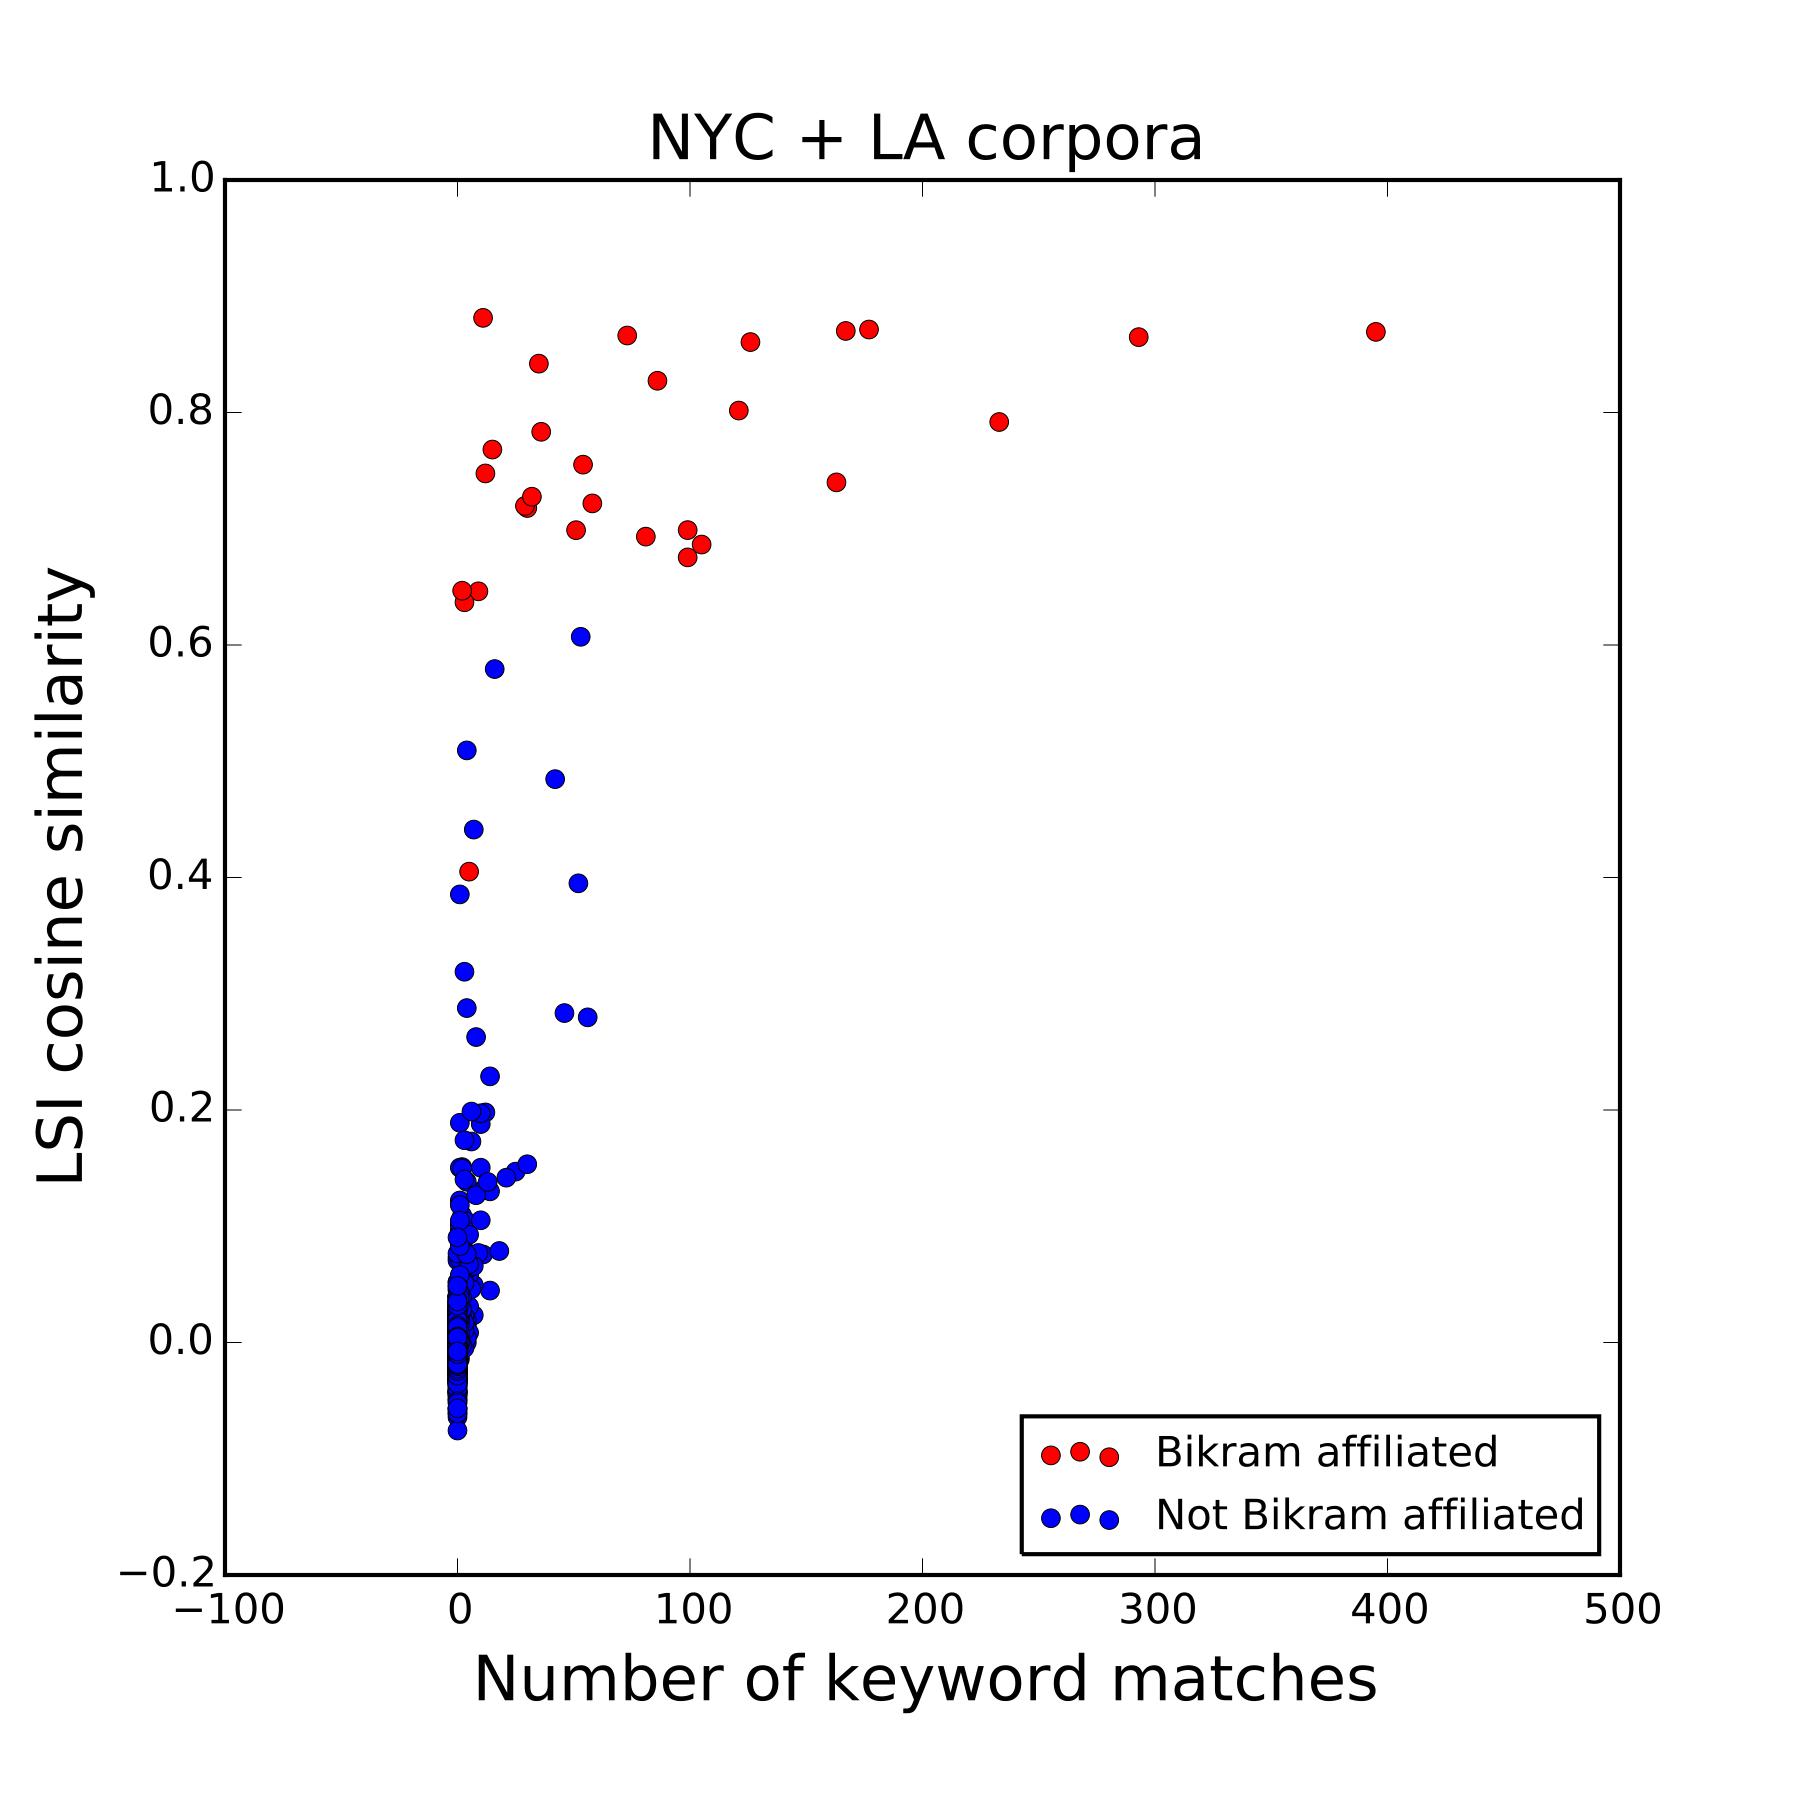
Figure 8: LSI cosine similarity versus number of keyword matches for the query “Bikram” for all documents in the combined NYC+LA corpus. Red dots are for reviews of studios affiliated with Bikram's Yoga College of India. For this query the LSI probabilities are significantly smaller than the Boolean-matching ones. A couple of effects are at play here. First, “Bikram” is such an important reference in the world of yoga that it is often used as a point of comparison for other yoga experiences. An unusually hot studio, or a strenuous workout, or a sequence of poses, can all inspire the reviewer to make a comparison with Bikram yoga, even in the context of a totally different yoga style. LSI detects this type of usage and flags it as being of low relevance (cosine similarity below threshold). A second effect is that Bikram (or more generally, hot yoga) may not be the main focus of a given business, but just one style among others on offer. This too tends to reduce the cosine similarity of a document w.r.t. the query. Among all documents in the combined NYC plus LA corpus, Figure 8 shows in red those reviewing studios that are officially affiliated with Bikram’s organization and therefore only teach this style of yoga. It is interesting that the red dots are all at high cosine similarity, but not necessarily at high number of keyword matches, indicating that LSI has better recall.
“Yoga nidra”
Yoga nidra refers to a type of guided meditation that induces what is known as yogic sleep, or lucid sleeping, the deepest state of relaxation in which one still maintains full consciousness of surrounding reality. 
Figure 9: LSI cosine similarity versus number of keyword matches for the query “Yoga nidra” for all documents in the combined NYC+LA corpus. This is a very specific practice, making it unlikely that a review could refer to it without mentioning it by name. Therefore it is surprising to see such a big difference between the retrieval probability of LSI and that of keyword matching. The main effect here seems to be lack of training opportunities. The entire NYC+LA corpus only contains about 15 studios that offer yoga nidra classes, and then typically as a small addition to classes of another style. In the reviews, the yoga nidra classes are mentioned but not described. This yields too little material for LSI to build on. The figure on the right shows a correlation plot of LSI cosine similarity versus number of keyword matches for the “Yoga nidra” query in the combined NYC+LA corpus. There is hardly any correlation. Furthermore, with such limited statistics it is hard to tell how accurate each retrieval method is. For example, the point with coordinates (1,0.92) corresponds to Yoga Nidra Studio in New York; its website advertises that it “offers vinyasa and deep relaxation classes for beginners and experienced students”, but it is not clear whether this includes bona fide yoga nidra. The points at (1,0.09), Integral Yoga Institute in NYC, and at (6,0.64), Yogala Echo Park in LA, do appear to offer yoga nidra classes.
We end this section by examining a set of queries that describe concerns yoga practitioners may have when selecting a yoga studio:
"well-managed welcoming friendly"
"competent knowledgeable informative"
"props blocks blankets belts bands straps"
"discount package donation bargain cheap affordable deal"
"personalized adjustments"
"community togetherness family"
"music"
"strenuous"
"crowded smelly packed full"
"parking"
The result of using LSI with these queries is shown in Figure 10. For clarity only the first word in each query is indicated on the plot.

The plot speaks for itself: the more important a concern, the higher its retrieval probability. Significant differences between NYC and LA are highlighted in red. Parking for example, is a much more important concern in LA than in NYC.
Interactive maps
To help interested readers find yoga businesses that cater to their needs, I produced interactive maps for the NYC area and for the LA area. Please check them out!
Conclusions
Among all yoga styles, Vinyasa is clearly the most popular, especially in NYC. Bikram gets talked about a lot, but is much less practiced. Yoga practitioners appreciate foremost a well-managed, welcoming and friendly studio. Discount packages and the availability (or lack) of props do not seem to elicit as many reactions. A sense of community seems more important on the West coast (as does parking space).
Technical note
For this analysis we used Boolean keyword matching and Latent Semantic Indexing (LSI). A more sophisticated version of keyword matching consists in ranking documents according to the sum of the TF-IDF values of the words in the query. We did not try this approach. However, we did try Latent Dirichlet Allocation (LDA), which is based on a statistical model of corpora and documents (as opposed to LSI, which, as pointed out above, is a purely algebraic method). LDA is typically used to identify topics in a corpus of documents, where a topic is a bona fide probability distribution over terms. Unfortunately it gives different results depending on the number of topics one believes to be present in the corpus (this is again different from LSI, which always yields the same latent topics, regardless of how many of those one decides to use.) In addition, LDA topics are very sensitive to the procedure used to trim the dictionary of terms (very rare and very common terms are eliminated from the dictionary, but there is no unique way of defining “very rare” and “very common”.) We were not able to obtain useful results from LDA. For example, the LDA topics failed the so-called “word intrusion” testJonathan Chang, Jordan Boyd-Graber, Chong Wang, Sean Gerrish, and David M. Blei, “Reading tea leaves: How humans interpret topic models” .
The figure below shows the analysis flow and data science tools used. The analysis code can be found in my GitHub repository.
